Have the Nationals developed the G.O.A.T. scoreboard?
Let’s give credit where credit is due. But, of course, I don’t know whom to credit But I think that the new Nats scoreboard is about as good as it could be.
I am not going to be able to do it justice, but referring to the two photos above, let’s work through what you can learn by looking at the scoreboard, even if you decide not to look at the game.
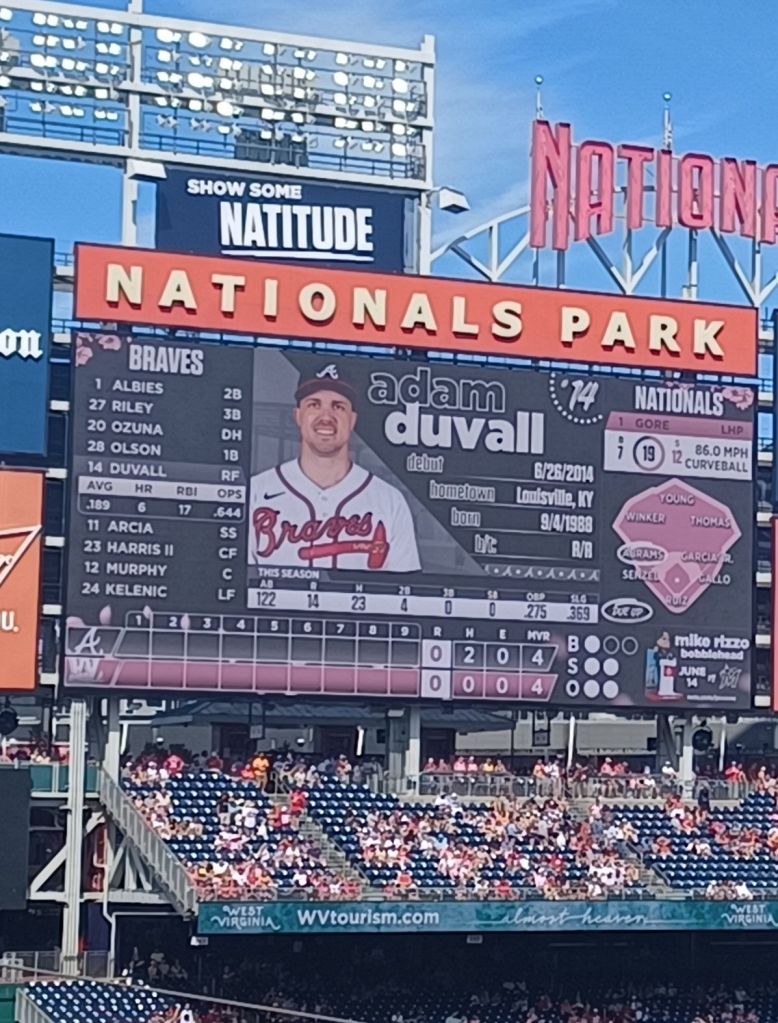
First, it should be obvious that the Nationals are playing the Atlanta Braves, and that the Braves are up to bat. And that the current Brave who is at the plate is Adam Duvall. In the center, you see his picture, you see that is uniform number is #14, you see that his major league debut was on Hannah Hessel’s birthday in 2014, that he was born in Louisville in September 1988, and that he bats and throws right handed. You can see that this year, he has hit 122 times, has had 23 hits and scored 14 runs, has doubled four times, hit no home runs or triples, has been on base 27.5% of the times he has come up to bat, and has a slugging percentage of .369.
(You should know that the center screen does not stay this way. It is where you see live feed, whether it’s the batter coming up to the plate, or a replay of the play after he has finished batting, or (in later innings) a list showing what he has done in previous appearances during the game, and – between innings and before the game – ads, promotions, the national anthem singer, information about the game and whatever else they want to show you.)
And one more thing. If Duvall happens to hit his first home run of the season (he didn’t), right below his picture, you would see another chain of numbers, showing statistics about that home run: how far it went, what was the speed of the ball off the bat, and what was the angle of its arc. That is all new stuff.
To the left of the middle screen, you see the Braves hitting line up, its 8 position players and its designated hitter, in the order in which they will bat. For each player, you see their position and their uniform number. You will see that Duvall is hitting fifth, and because he is at bat, you see a little more information about his – his current batting average, the number of home runs he has hit, the numbers of runs he has batted in, and his OPS. If you don’t know what an OPS is, it’s a calculation based both on the number of times a hitter gets on base and the number of times he gets extra base hits. It’s an arcane measure, and all you really need to know is the higher the better, and Duvall’s is not very high. Those who are having a good year at the plate may find their OPS at .900 or even higher.
Now, if you move to the right of the screen, you see information about the Nats, who are in the field. Obviously, when this inning ends, the information you see about each team will reverse.
You start at the top with the identity of the Nats’ pitcher, who is Mackenzie Gore. You see his uniform number is #1, and that he is a left handed pitcher. We were still in the top of the first inning when I took the picture, and Gore had thrown 19 pitches (pitchers usually don’t throw more than about 100 on a good day), of which 7 were balls and 12 were strikes (you’d like to see a pitcher throw twice as many strikes as balls). You also see something about his last pitch. It was an 86 miles per hour curve ball.
Below the information about Gore, you see an outline of the ball field, with the name of each Nationals position player at the place where he is playing. You also see that the name of one of the Nats position players, Abrams, playing short stop, is circled. This shows you that when the Nats come to bat, Abrams will be the next (in this case the first) to get to the plate.
Looking below everything I have mentioned so far, you see the traditional center of a baseball scoreboard. An inning by inning account of the runs scored by each team. At this point in the game (the top of the first inning), no runs have scored. (By the way, to take away the suspense, the final score will be Washington 7, Atlanta 3.) To the right of the inning by inning scoring, you will see the total runs to date, the total number of hits each team has had, the total number of errors (if any), and the number of times left that there can be a visit of catcher, manager or coach to the pitching mound (the total allowed per game is only 4).
Then, to the right of that, you will see statistics regarding the person presently at bat. You will see that there is one ball (four balls and the batter advances to first base, just as if he had hit a single), and two strikes (three strikes and you’re out). Under that you will see that there are already two outs – one more out, the inning ends, and the Nats come to bat.
Even further to the right, you see a promotion for a Mike Rizzo (he’s the general manager) bobble-head on June 14. That promotion stayed up on and off throughout the game. But each time a batter finishes, the display changes to show what happened to the batter in the “language” one would use if he/she were filling in their own scorecard. For example, if a hitter grounded out to the second basement, who then through to first, it would GB 4-3. If the hitter, struck out with a called strike, it would say K. And so forth. (There is a whole language here – Google it if you want to learn more)
That’s pretty much it for the big screen. But remember that the large center panel changes and changes, as I described above.
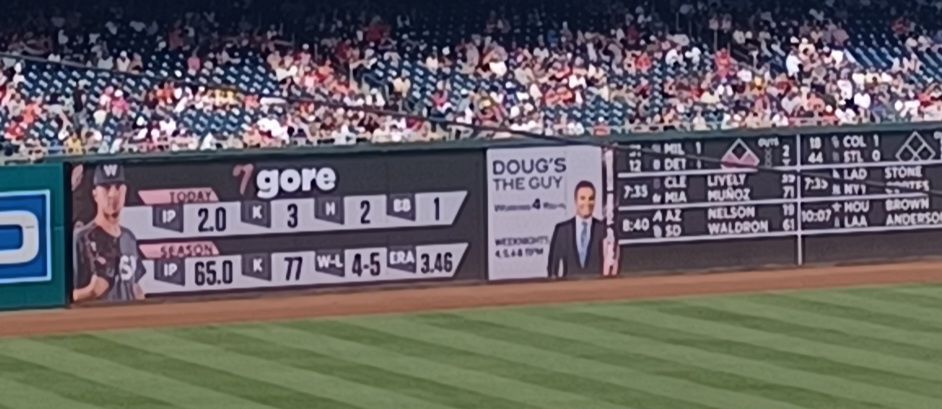
But the big screen is not all. Below, in front of the first deck spectators, the wall going down to center field shows more, as you can see from the second photo. To the right, you see what is going on in every other game being played that day; that, like the inning scoring, is an old standard for baseball scoreboards. But to the left, you see information that there just was not room for above. This is information about the pitcher, again in his case Mackenzie Gore. I took this photo a few innings later, so the info doesn’t correspond with the first inning information on top.
Here you see that Gore has pitched two innings, struck out three, allowed two hits, and walked one batter (BB – base on balls – is the official name for a walk). Below that, you see Gore’s statistics for the entire season – he has pitched 65 innings, struck out 77 batters, has a win-loss record of 4-5, and has allowed an average of 3.46 runs to be scored against him per every 9 innings (a game). This is actually quite a good record; the 4-5 win-loss statistic is a result of the Nationals weak hitting record so far this year. (The Nats overall record today is 30-35, five below .500).
This tells you pretty much what you will learn from the scoreboard. Of course, if you sit in the outfield seats, you won’t see the scoreboard at all. You will be much more basic statistics shown down the first base line, but you really miss out on something, I think.
And for those of you who knew nothing about baseball, if you study this post, you will learn about 10% of what you need to know to really understand the game.
And is anything missing from the scoreboard? What about a clock. Usually, I think a scoreboard has a clock. At Nats park, the clock is located above the Nats bullpen. Not a problem (and it’s digital, so you don’t even have to be able to tell time).
